Throughout bitcoin’s short history, it’s continually demonstrated its ability to absorb liquidity. This has resulted in the awareness of a well-known correlation between bitcoin’s price and measures of regional or global liquidity, such as the M2 money supply.
The M2 money supply is a measure of the total amount of money available in an economy, including cash and easily convertible instruments. It is a broader measure than the M1 money supply, which includes physical currency and demand deposits (like checking accounts).
The below chart demonstrates the correlation between the bitcoin price and the US M2 money supply. Interestingly enough, the mathematical equation that best captures this relationship is a power law.
Because FRED only releases US M2 data every month, I’ve plotted the month end bitcoin price vs the M2 value for that month.
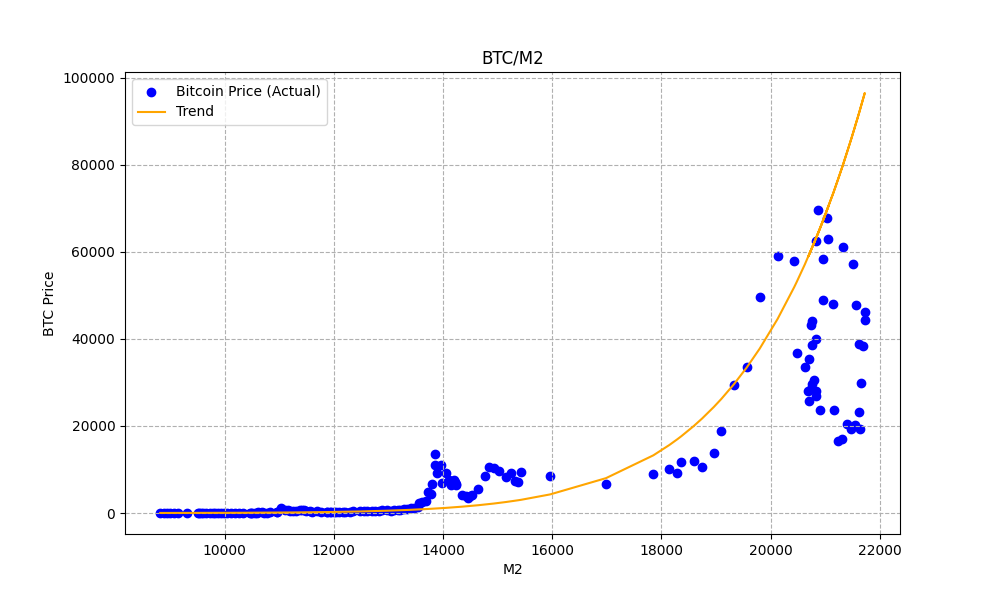
As you can see, it’s a reasonable fit. In fact, in linear terms, we get an R squared of 0.86, suggesting that 86% of the variance in price is explained by changes in the value of M2.
This relationship can best be visualized when taking the log of both sides:

Now we can use our model to predict the bitcoin price based on historical M2 values. Here is a chart of the actual bitcoin price along with the model price.
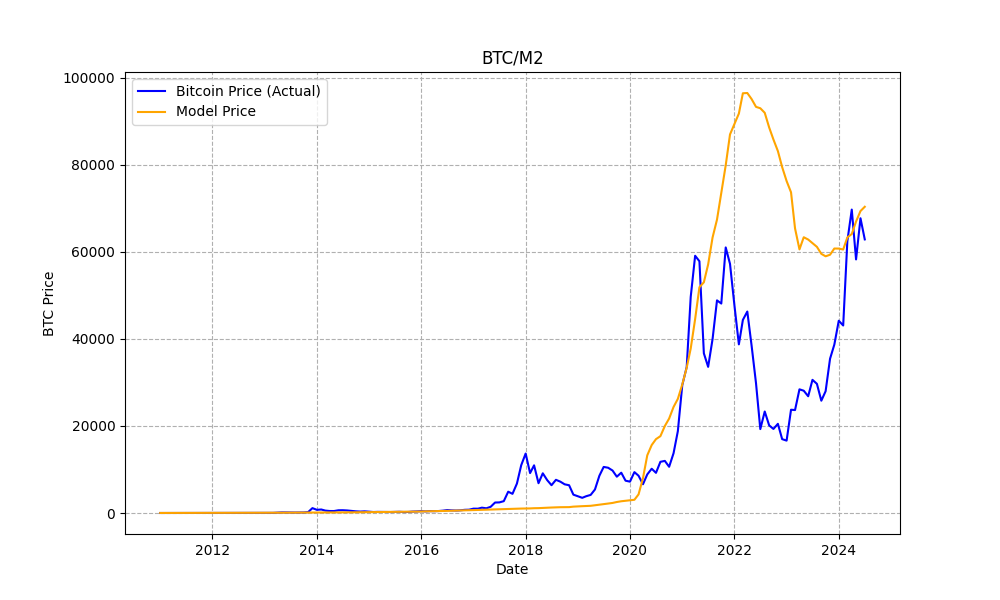
Interestingly, the model predicted a higher price for bitcoin during the 2021 bull market (~$100k). This suggests that the bull market may have been cut short (and likely was cut short) due to China banning bitcoin mining!
The model is limited in its ability to predict future prices because that would require an accurate forecast of M2 growth. Having said that, US M2 has been growing more or less exponentially, suggesting we can predict M2 growth somewhat accurately.
Here is the formula yielded by our simple model:
y = 1.29 × 10^−39 * x^10.116
Based on this formula, the bitcoin price will hit $1M when US M2 reaches roughly $28T (currently $21T).
Assuming US M2 continues to increase at the same average rate that it has been increasing for the last 15 years, this will happen in late 2028/early 2029 approximately 4 years from now.
That seems a tad optimistic to me, but who knows!